Summary
As government, philanthropy, and the private sector become increasingly aligned around the need to share prosperity more equitably in the US, particular momentum has grown to strengthen economic mobility – in the form of breakthrough research, ambitious policies, and powerful coalitions.
However, as strategic advisors in this field, it is clear that varying definitions of economic mobility can lead to misalignment and misunderstanding among the stakeholders working to advance it. In the US, this definitional ambiguity explains conflicting headlines: some suggest economic mobility has not declined over recent decades, while others underscore the fading American Dream. Such diverging narratives can be explained by the fact that each of the four most common measures of economic mobility tells a different, and valuable, story regarding the current state of economic mobility.
Stakeholders in this space ought therefore to be clear about the definition they are using; intentional in selecting the definition that best elucidates the questions they consider to be priorities; and cognizant that a complete view of economic mobility requires regular consideration of all four measures as complementary sources of insight.
What is Economic Mobility?
In simple terms, economic mobility denotes the change in economic status of an individual, household, or group over a defined period of time – typically by reference to income or wealth. Within each measure of economic mobility, an improvement in economic status is termed upward mobility, while a decline is referred to as downward mobility.
Why Track Economic Mobility?
Tracking economic mobility allows us to determine, with some empiricism, the answers to questions that are central to our socio-economic policies and social investments. These questions include:
- How many people are experiencing a particular economic status at any given time, and how has their economic status evolved over time?
- Which variables correlate most closely with changes in economic status? Are these merely correlative, or demonstrably causal?
- Which individuals, households, demographic groups, or geographic localities are most likely to experience a change in economic status?
- For whom is intergenerational prosperity most strongly / weakly sustained?
The answers to these questions, in turn, allow us to test how far national narratives around equality of economic opportunity hold true. In the case of the United States, these include testing whether the US really is a land of greater economic opportunity than others, as is often claimed – and if so, under what definition of opportunity, and for whom?
Income vs. Wealth as Proxies for Economic Status
First, a framing issue: perspectives on the current state of economic mobility in the US and many other nations vary, to a certain degree, according to whether income or wealth is tracked.
Income captures the flow of money received from sources such as a salary, business income, dividend pay-outs, and state benefits. Typically, income therefore represents immediately deployable resources (e.g. a salary provides cash reserves that can be used instantly to pay for goods). It tends to be more evenly spread across a population than wealth, as illustrated in the first graphic below.
In contrast, wealth provides a more expansive view of economic status, reflecting net financial worth. Wealth includes elements such as savings, assets in possession, and other financial interests, minus any liabilities. It is usually less evenly spread across a population than income and has become even more so in the US over recent decades, per the graphic below. However, the value of one’s wealth may not all be instantly realizable (e.g. a property is a valuable asset, but can take time to sell).
While wealth is, logically, a better indicator of the true distribution of prosperity across a population, exact definitions of wealth vary – leading to difficulties in sourcing complete and consistent data. Data on income is more readily available and less contested. As a result, many pioneering analyses of US economic mobility over the last decade have relied on income data and this article will also adopt income as its focus.
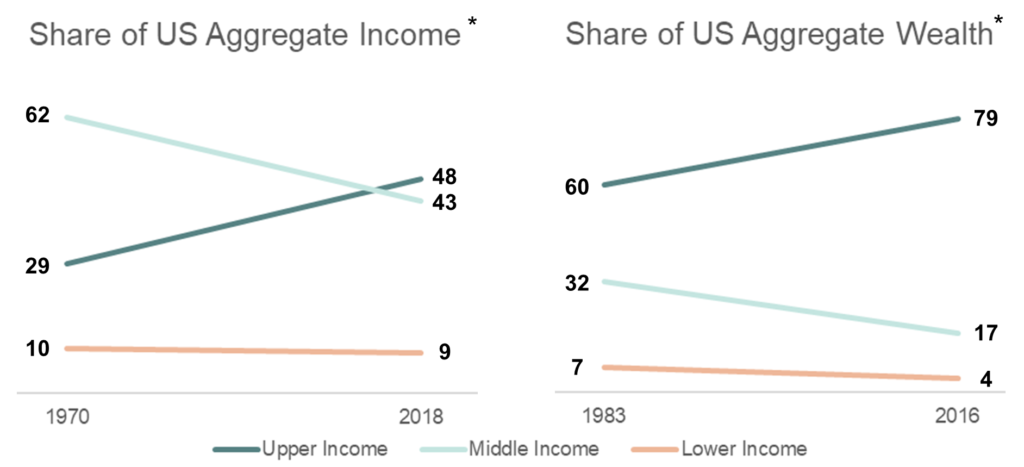
*All figures in 2018 US dollars
Visuals recreated from Pew Research Center: 1. Trends in income and wealth inequality
Data Sources: Pew Research Center analysis of Current Population Survey, Annual Social and Economic Supplements and Pew Research analysis of the Survey of Consumer Finances
Indicators of Economic Mobility
Once either income or wealth has been chosen as the subject of study, there are four potential measures of economic mobility to choose from. Each measure may generate a different top-level insight, and each may resonate to varying degrees with different stakeholders, depending on their social interests and objectives.
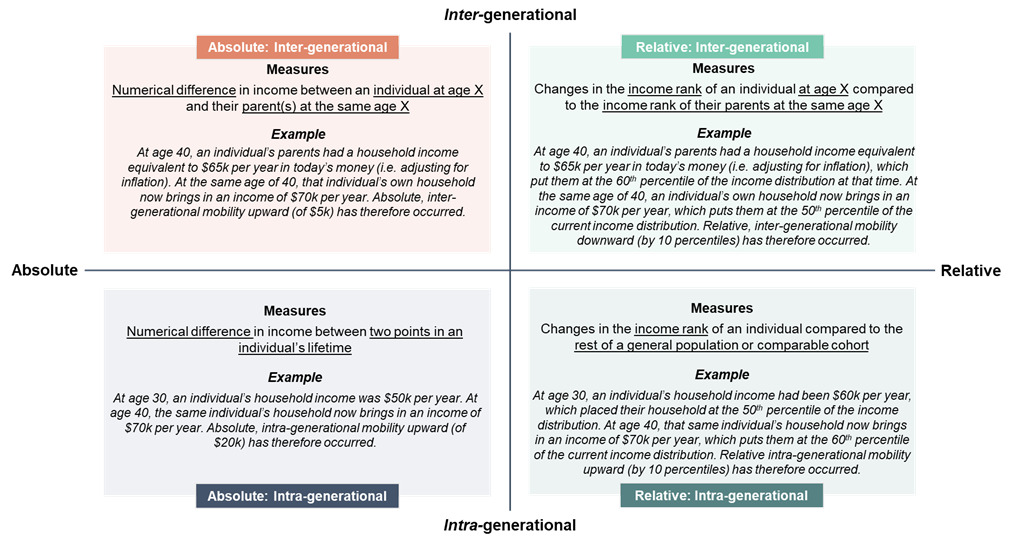
The four potential measures all involve some combination of two key indicators:

These are distinct measures. As such, absolute mobility does not always correspond to relative mobility.
By way of example: Income for Household A may increase in absolute terms from, say, $60,000 to $70,000 per year over a particular timespan. This indicates absoluteupward economic mobility of $10,000 (note: this increase will need to be adjusted for inflation, to calculate the increase in income in real terms). But if many other households in the population also experience a similar rise in their incomes over the same timespan, then the rank of Household A’s income relative to others may not materially change. The relative mobility of Household A in this case would be neutral, even though it was upwardly mobile in absolute terms. How far this should be of concern will depend on your social interests and objectives – as discussed further below.

Again, the indicator chosen here enables different analyses. Intra-generational mobility is largely disconnected from inter-generational mobility, as a subject of study.
To continue the example cited above: It is possible to see an intra-generational increase in household income from $60,000 at age 30 to $70,000 at age 40. Assuming this increase in income is true in real terms (i.e. it has been adjusted to take account of inflation), this would indicate intra-generationalupward mobility. However, if that same individual’s parents earned a greater household income than $70,000 when they were aged 40 (also adjusting for inflation), then that individual has in fact experienced downward mobility on an inter-generationalmeasure, despite income having increased in absolute terms.
Therefore, the four potential measurement permutations that can be derived from combining the two indicators of Economic Status and Timespan are:
Now that definitional bases have been covered and illustrated with examples of the differing insights each measure can potentially generate, the next step is to understand how each measure is valuable for informing different points of inquiry.
Analytical Implications: Absolute vs. Relative Economic Mobility
Absolute mobility
Absolute mobility can theoretically be experienced by all individuals at the same time, if there is a period of sustained economic growth and the economic benefits of that growth are distributed across the entire population (whether to equal or unequal degrees).
This measure naturally resonates with stakeholders interested in overall evolutions in living standards over time and the alleviation of absolute poverty. It may be the single purest measure of economic mobility for understanding aggregate changes in economic status from a strictly numerical perspective. It is also the default measure of economic mobility for a number of eminent stakeholders at the present time, and a focal measure for the most large-scale analysis of economic mobility data conducted in the US to-date.
However, looking exclusively at this measureoverlooks the importance individuals may attach to their sense of economic rank within society (often called class), and our ability to move up or down in that rank (sometimes called social mobility, or relative economic mobility as above). These shortcomings are important to acknowledge for two reasons:
- First, at the theoretical level: one founding aspiration of a free market economy (whether it follows a completely free market model or a more ‘social democratic’ model) is that it should, in principle, enable the meritocratic movement of a meaningful proportion of individuals up and down the quintiles of the income distribution (i.e. economic rank) according to their oscillating economic fortunes and misfortunes. Where this is not occurring with moderate frequency, it is often an indication of an economy that has been skewed by policy choices and power dynamics to preserve particular economic interests for some, while maintaining barriers for others. If a fixed economic ‘underclass’ exists and only a small minority of aspiring individuals in that lowest quintile of wealth, or underclass, are able to reach the middle quintile or higher, then something is structurally amiss.
- Second, at the level of the individual: a sense of diminished power, belonging, and social cohesion can be felt even byindividuals who experience a material increase in income in absolute terms, if the income of others has risen by an equal or even greater proportion. In practice, this can drive status anxiety in the same way as wealth inequality more generally, and ultimately threaten our democracy, political stability, and sense of collective identity if left untreated over time – as is the case in the US and certain other high-income countries currently.
These factors suggest that absolute measures of economic mobility are a powerful and prevalent, but also insufficient, method of measuring economic mobility if used as the sole measure.
Relative mobility
On the other hand, relative mobility seeks to measure the degree to which people can move among different levels of economic outcomes. Relative economic mobility is a zero-sum game of constantly evolving ‘winners’ and ‘losers’ analyzed within the paradigm of a competitive hierarchy. If incomes are grouped into quintiles (as is often done to simplify analyses of relative mobility), then each quintile represents exactly 20% of the population. In order to achieve upward relative mobility (i.e. a movement up into a higher income quintile), someone else must necessarily drop down to a lower quintile so as to make space.
While this analytical lens may initially appear at odds with the progressive ideals of some stakeholders working to advance economic mobility – in the sense that it forces individuals into a competitive paradigm and is often cited by more conservative thinkers – the insights it can generate can in fact be applied to inform and reinforce profoundly progressive concerns.
Indeed, stakeholders focused on eroding class systems and maximizing social mobility (i.e. changes in economic rank), rather than on aggregate increases in income or poverty eradication, can draw immense insight from tracking economic mobility in this way. This tends to include stakeholders who define their objectives in terms similar to the traditional definition of the American Dream: the idea that those who find themselves at the bottom of the income distribution maintain a realistic shot at climbing to the top of the distribution over time.
Similarly, those focused on equality of opportunity may favor this measure as a means of assessing the prospects of specific groups moving out of the lower wealth quintiles, which are associated with reduced power and autonomy.
Lastly, a relative mobility lens reveals how evenly or how fairly the benefits of aggregate increase in economic status are being shared across a population: while an absolute measure of mobility might show an overall picture of a numerical rise in incomes in a particular country or region, a relative mobility lens shows how proportionately the aggregate rise was allocated to specific groups of interest relative to others.
However, relative mobility also has its drawbacks. Stakeholders who ground their analyses in a relative measure alone risk missing the ‘bigger picture’ on the overall changes in economic status of the population. Strong or stable levels of relative economic mobility are considered by many stakeholders to be a vacuous goal, if absolute economic mobility is declining in parallel – as appears to be the case in the US currently. In addition, an over-emphasis on relative measures may encourage individuals to focus on psychological drivers which many may consider harmful, such as a propensity to evaluate one’s own success in terms of power and status over others, rather than evolving mindsets towards a model of shared prosperity in which the focus remains on ‘all boats rising’.
Analytical Implications: Inter-generational vs. Intra-generational mobility
In contrast to the more complex nuances on relative vs absolute measures, the implications of inter-generational vs inter-generational analyses may be more intuitive.
Inter-generational mobility
Inter-generational analyses tell a stronger story of how a country, as a whole, has fared over time, by showing how one age cohort has progressed as a whole, relative to the parents (or grandparents) of those in that cohort at an equivalent age. For this reason, most large-scale studies of economic mobility in the US point to an inter-generational measure. This measure has provided many of our most powerful insights on how far the US is living up to its ideals and whether prevailing narratives of economic opportunity are borne out in reality, across different regions, counties, and neighborhoods.
However, inter-generational measures also run the risk of being seen as overly academic and detached from the immediate concerns of individuals. While knowledge of how individuals are faring economically relative to their parents is invaluable, it is also removed from the immediate needs and priorities most people are focused on, namely: how can I continue to improve my (or my household’s) economic status?
This leads many stakeholders involved in direct efforts to spur economic mobility in the present to dismiss inter-generational analyses, as they may not provide practical insights to apply. Others appreciate their value, but question how far inter-generational analyses can help them to build evidence around the causal link of certain variables to economic mobility. To-date, inter-generational analyses have offered powerful discoveries as to the variables that may correlate with economic mobility, and the ways in which these variables appear more or less prominently across localities (in the US), but analyses of causation remain under study.
Intra-generational mobility
Intra-generational analyses are naturally most effective at conveying the evolution of individuals through their various life stages, and for pinpointing specific age brackets or events that tend to correlate with a change in absolute or relative economic status (e.g. acquiring a new qualification, marriage, parenthood, new mentors/networks, or health crises). These analyses are powerful in identifying trends based on specific variables, which can then help to inform promising program interventions or policy choices going forwards.
As such, many organizations directly servicing individuals, such as those seeking to alleviate poverty or tap into an under-utilized lever of economic opportunity, may do well to track their impact according to the intra-generational economic mobility of those they support. Similarly, most of us logically think about our own economic mobility in these terms, as we aim to experience upward mobility over the course of our lifetimes.
Notwithstanding these benefits, this measure is also the most narrow and future-oriented, by design. Its practical utility and resonance are clear, but it says little about the true current state of economic mobility.
Synthesis of potential measures of economic mobility: pros and cons
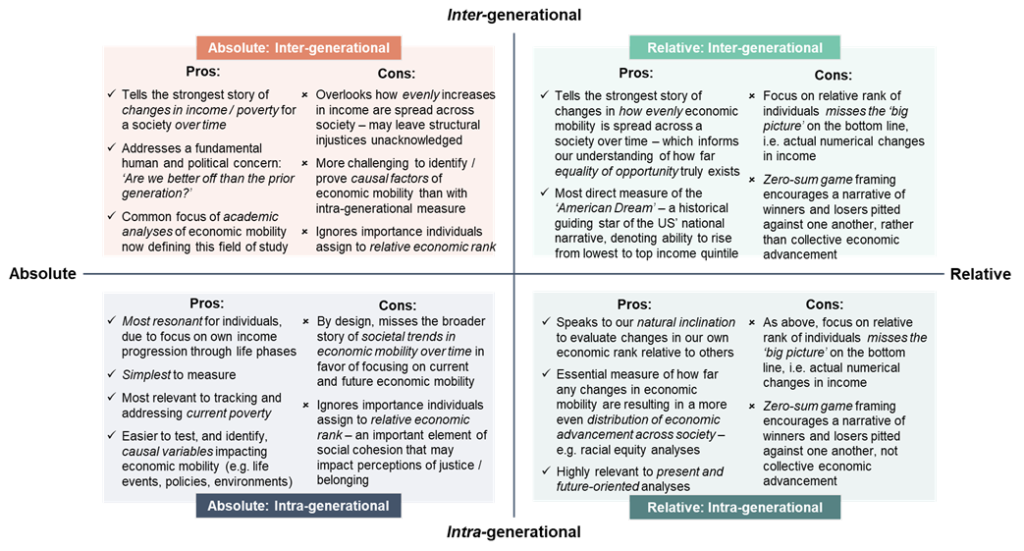
In sum: the varying measures of economic mobility can be used to obtain different insights, and to inform and disseminate differing social agendas. Stakeholders should be sure to be clear about the measure they are referring to, thoughtful as to their choice of measure and its pertinence to their agenda, and regularly triangulating the insights provided by all four measures in order to maintain the strongest possible understanding of economic mobility in their geography of interest.