This piece discusses the implications of public benefit access disparities across states in the US and presents a methodological approach applied by Camber to identify and address disparities at the state level. Due to the geographic variations in benefit access challenges, benefit policies and design, and population demographics, funders and other stakeholders working to improve equitable access to public benefits should use tailored approaches to address access and delivery gaps. Camber conducted analyses that resulted in a geographically tailored approach to improving the public benefit system that can help stakeholders in this sphere refine their state-based strategies.
Introduction to the Public Benefits System
Access to public benefit programs in the US plays a pivotal role in advancing economic security and enabling upward economic mobility for the almost ~100 million individuals living in or near poverty (See End Note 1).[i] At least 15 federal public benefit programs help to stabilize income or to mitigate housing and health needs, some of the largest being the Supplemental Nutrition Assistance Program (SNAP), Earned Income Tax Credit (EITC), and Temporary Assistance for Needy Families (TANF). Public benefits have grown considerably in scale and impact since the 1960s; in 2018, public benefits reached about one-third of all people in the US and have reduced the poverty rate – per the Supplemental Poverty Measure (SPM) (See End Note 2) – by almost 50%.[ii]
Figure 1: Percent of US population below Supplemental Poverty Measure (SPM) threshold from 1970 to 2018
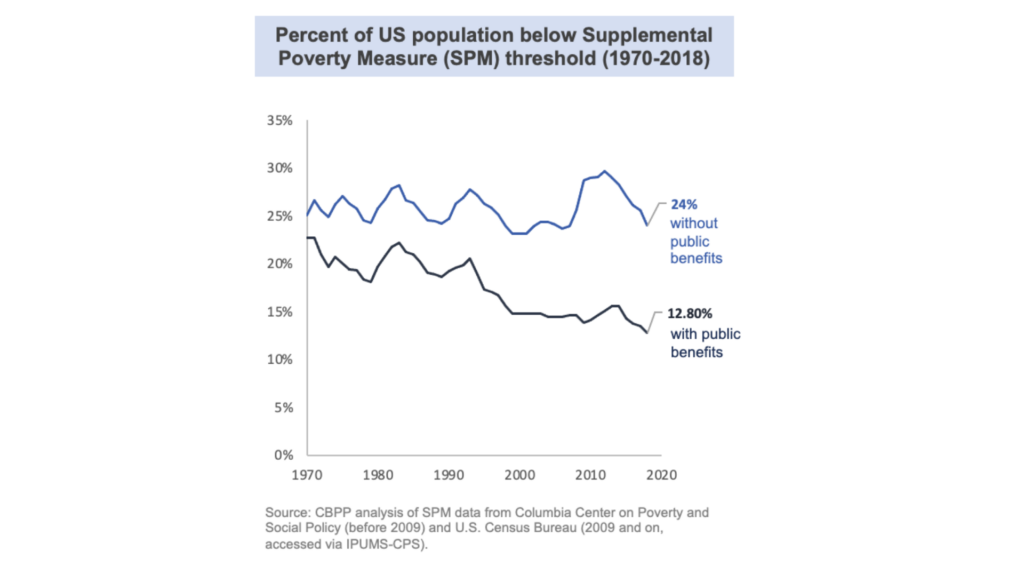
While generally effective in reducing poverty for their participants (to varying degrees), public benefit programs encounter persistent challenges that hinder their accessibility and the efficiency of their delivery, which in turn limit their impact in addressing economic disparities and expanding economic security. In particular, although public benefits have reduced the poverty rate for all racial and ethnic groups since 1967, racial and ethnic disparities in the poverty alleviation impact of benefits persist today: poverty rates after accounting for public benefits remain substantially higher among Black and Latino people than white people,[iii] even if poverty still impacts white people in the highest absolute numbers.[iv] Addressing these inequities remains a critical focus for ensuring the equitable impact of public benefit access initiatives.
Key Access and Delivery Challenges
The primary challenges hindering equitable access to, and delivery of, public benefits include bureaucratic burdens, disincentives to participate in these programs, and prejudicial policies – all of which undermine the impact of benefit programs (See End Note 3). These key challenges, outlined below, primarily affect the number and composition of eligible people and the experience and success of application submissions, with outsized impact on the lowest-income individuals and marginalized groups.
Disincentives deter eligible people from applying | Hard-to-navigate requirements and limited awareness sometimes lead to false assumptions of ineligibility among otherwise eligible individuals.[v] [vi] Some populations experience pervasive, harmful narratives that deter them from engaging with the benefits system. These disincentives include immigrants fearing the immigration implications of being deemed a “public charge”[vii] and Black women historically being targeted with stigmatizing, racist narratives,[viii] to name but two.
Bureaucratic burdens prevent or delay interested people from receiving benefits | Convoluted requirements, difficult-to-use application formats, and outdated technology systems burden government officials administering benefits, strain applicant time and energy, and in many cases, lead to significant delays in receiving benefits.[ix] [x] [xi] These burdens are exacerbated for marginalized groups who already face systemic inequities, such as for Hispanic/Latino individuals who experience more enrollment difficulties and worse customer service when applying for Medicaid/CHIP and SNAP, compared to their white counterparts.[xii]
Prejudicial policies limit reach and poverty alleviation impact of benefits | Stringent eligibility requirements prevent people who still need support meeting their basic needs from accessing benefits, leading to “benefits cliffs” – disproportionately affecting people of color.[xiii] Limited government resources mean benefit policies are not able to cover all eligible people.[xiv] Moreover, for those who receive benefits, amounts can often be too low to support their complete basic needs.[xv] Additionally, states have discretion in interpreting eligibility requirements, determining how to administer benefits, and setting benefit amounts, which leads to a patchwork of policies across the U.S. While state discretion allows for flexibility to serve their unique populations, this has also been shown to exacerbate inequitable outcomes. For example, the most restrictive policies and least generous benefits are, by and large, in states with larger Black populations.[xvi]
The ramifications of these challenges are substantial: 13 million people in poverty do not access benefits they may be eligible for,[xvii] resulting in $80 billion in benefits going unused each year.[xviii] The population in poverty – for whom this system is designed – is disproportionately comprised of marginalized groups, such as people of color.[xix] As such, barriers to accessing the public benefit system perpetuate economic inequities, particularly in states with higher populations of marginalized groups.[xx]
Camber Methodology: How Funders can Tailor Strategies for State-based Impact
The landscape of poverty in the US is not homogenous, and despite the major means-tested benefit programs being funded at the federal level, states are typically tasked with implementing the programs for their distinctly different populations. Accordingly, funders and other stakeholders interested in addressing key challenges to benefit access and delivery should consider tailored approaches at the state level. There are two fundamental questions funders should consider when developing a state-level impact strategy:
- Which states offer the greatest impact potential? What parameters of impact are most important to your organization?
- Which state typology offers opportunity for impact that is most aligned with your organization’s objectives? What dimensions are most important to consider when tailoring a strategy or intervention to a state’s implementation context?
To illustrate Camber’s methodology, we have detailed below how Camber supported decision-making around state-level public benefits strategies for our client – a coalition of national and place-based funders. Camber conducted an analysis of impact potential in each state if public benefits access and delivery were improved. Camber then developed a state typology framework for characterizing the implementation context surrounding benefits access and delivery systems within states. The results of our analyses are outlined below, and additional detail and data sources are provided in End Notes (See End Notes 4 and 5).
Part 1: Which States Offer the Greatest Impact Potential?
The impact analysis was composed of a two-step process accounting for the following impact parameters: greatest anti-poverty effect possible, scale of the population(s) to serve, and racial/ethnic economic disparities to address (Figure 2). The parameters and their indicators were selected with critical input from our project partners at the Urban Institute, informed by interviews with 50+ key informants at organizations across the US working to improve benefit access and delivery, and supplemented with a comprehensive desk review of academic and grey literature. While these parameters are certainly not the only possible criteria to use, they were prioritized to align with the strategic priorities of our client. Other funders should consider additional or alternate parameters in accordance with their own organizational objectives.
Figure 2: Two-step impact analysis process
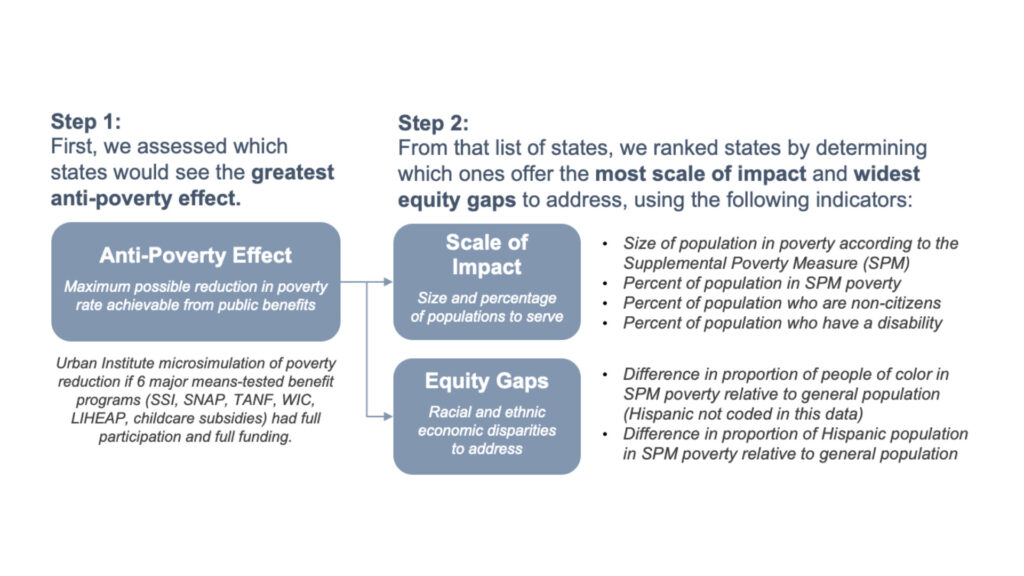
In the first step, we assessed for which states high participation in public benefit programs would have the greatest anti-poverty effect, or reduction in the poverty rate. The anti-poverty effect was determined based on results from a recent 50-state analysis of poverty reduction if 6 major means-tested benefit programs had full participation and full funding, conducted by our project partners at the Urban Institute.[xxi] The anti-poverty effect varies widely across states due to numerous factors, including but not limited to benefit policies (e.g., eligibility and benefit levels), benefit program participation rates, and economic conditions. For instance, the poverty rate in Oklahoma would reduce by just 20%, whereas Hawaii would see a transformational 46% reduction. [xxii] Accordingly, states with the greatest projected reduction in poverty rates were short-listed.
Then, in step two we identified among those short-listed states, which ones would offer the greatest scale of impact and opportunity to address the widest equity gaps. The indicators we selected focus on the demographic characteristics of populations shown to experience outsized barriers to benefit access, which are those with incomes below poverty thresholds, people of color, non-citizens, and people with disabilities. There is notable geographic variation across these demographics. While evaluating scale of impact, we found that the most populous states like California and Texas have large numbers of people living in poverty, whereas the Southern states, including Louisiana and Mississippi grapple with the highest poverty rates.[xxiii] The largest states tend to have larger numbers of non-citizens, and high proportions of people with disabilities occur in Appalachia as well as in the South.[xxiv] In terms of equity gaps, several states have relatively larger economic disparities for people of color and Hispanic/Latino people, in which there is an over-representation of those sub-groups in the population below the poverty threshold as compared to the general population. Some of these states include Connecticut, Mississippi, New York, and Louisiana.[xxv]
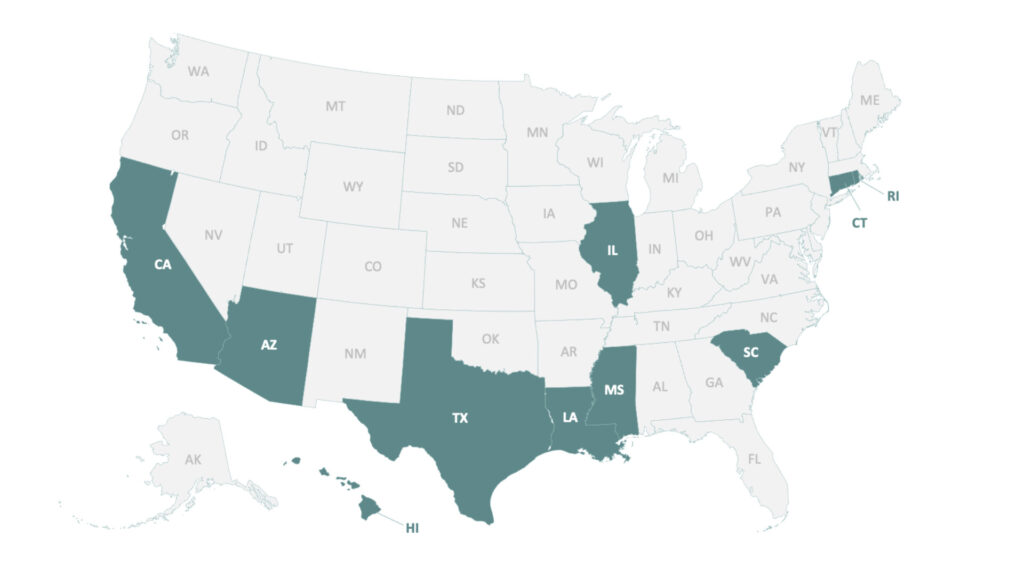
Using these parameters, the resulting ten states identified to have the highest impact potential were: Arizona, Connecticut, South Carolina, Texas, Louisiana, California, Illinois, Hawaii, Rhode Island, and Mississippi (Figure 3).
Figure 3: Ten states identified to have highest impact potential
Part 2: Which State Typology Offers Opportunity for Impact Most Aligned with your Objectives?
We defined illustrative state typologies that characterize the context in which interventions for benefit access would be implemented. To do so, we started by identifying two key dimensions on which states differ: delivery system efficiency and benefit access policies. We assigned descriptive indicators using publicly available data to quantify where states fall on these dimensions. An overview of each dimension and its indicators is provided below, and additional details on data utilized are available in the end notes (See End Note 5). While this framework considers a range of indicators of benefit access and delivery relevant to Camber’s work with the coalition of funders, it is non-exhaustive and may not encompass all factors another organization may need to consider when developing state impact strategies. Funders interested in tailoring their strategies may also consider alignment with organizational or program objectives, existing relationship to state delivery agencies, timing relative to election cycles, and other factors. Each state of interest to an organization should be considered on an individual basis with the most up-to-date, comprehensive information.
Efficiency of State Delivery System:
As discussed in the Key Challenges section above, bureaucratic burdens can prevent or delay individuals from participating in benefits for which they are eligible. The Code for America Benefits Enrollment Field Guide demonstrates that state delivery systems differ widely in how efficiently they deliver benefits, in large part due to the extent to which agencies modernize their delivery systems and design them to deliver human centered services. Building on that assessment, we selected the following indicators to be illustrative of the end-to-end process of benefit delivery.
- How user-friendly is the benefit application process?
- How integrated are the enrollment systems?
- How timely is benefit delivery?
State Benefit Access Policy Choices:
As discussed in the Key Challenges section above, a state’s benefit policies have a strong influence on the reach and impact of benefits for its population. We find that there are distinct regional trends in benefit policy choices, as depicted in a recent analysis from the Center for American Progress. States in the South are the least likely to adopt policy choices that maximize benefit amounts and accessibility to their constituents; whereas the Northeast has an overall stronger safety net relative to other regions, and supplements to federal policies and programs tend to be stronger and more common.[xxvi] Drawing on that analysis, we selected the following indicators to encompass historic and recent policy decisions that make benefits easier for claimants to access.
- Has the state adopted policy options that maximize access and reduce burden for claimants?
- Has the state funded state-specific tax credits?
- Is there momentum in the state to pursue benefit access and delivery improvements?
We then mapped the 10 states with the highest impact potential to the two dimensions, presented in Figure 4 below. The intersection of these dimensions created four illustrative state typologies, whichbring forth various implications for implementation, including a state’s potential likelihood of investing in public benefit access and delivery, extent of political or structural challenges to overcome, and the scope of opportunities for incremental improvements. Below, we describe the four illustrative typologies that we offered as an initial framework for our client to consider which operating environment(s) may be best fit for their program objectives. With further data inputs and analysis, these typologies can be refined to evaluate additional implications relevant to other funders. Additional aspects may include historical time and cost scales required to see measurable impact in a state, or a state’s inclination to invest in systems transformations rather than incremental enhancements.
Figure 4: Ten states mapped to illustrative state typology framework
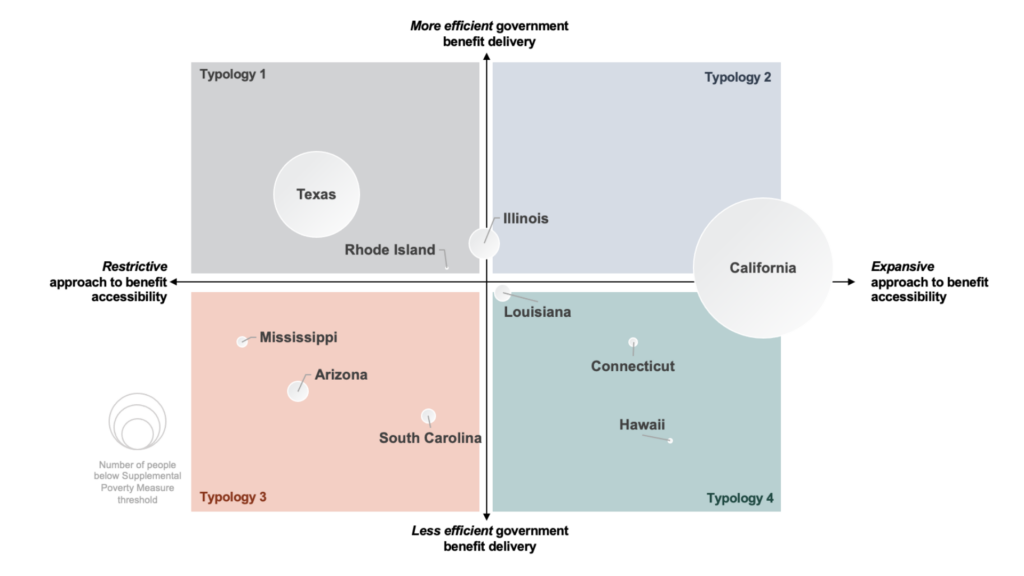
Typology 1 (Top Left Quadrant)
These states have historically been reluctant to make policy choices that expand access to benefits; however, their delivery systems are relatively more efficient than other states. While working in these states may present a challenging policy environment, they may offer scope to explore incremental delivery system enhancements.
Typology 2 (Top Right Quadrant):
These states have made policy decisions to expand benefit accessibility and have relatively more efficient delivery systems than other states. These states may offer implementation contexts most amenable to organizations interested in improving public benefit access and delivery.
Typology 3 (Bottom Left Quadrant):
These states have historically been reluctant to make policy choices that expand access to benefits, and they have relatively less efficient delivery systems. Working in these states may pose more political and structural challenges than other states yet may offer greater scope for potential impact.
Typology 4 (Bottom Right Quadrant):
These states have made policy decisions to expand benefit accessibility; however, their delivery systems are relatively less efficient than other states. Working in these states may pose a more supportive policy environment and may offer scope to explore delivery system enhancements.
Conclusion
As we recognize the nuanced challenges in public benefit access and delivery, our analytical approach is grounded in critical impact parameters and real-world context, with an orientation toward maximizing positive outcomes for those facing the greatest economic disparities. Camber’s methodology provides a strategic foundation for intervention and serves as a systematic starting point for organizations refining their state-based impact strategy. Employing the geographically tailored approach detailed in this article can empower organizations working to amplify the impact of public benefits in reducing poverty and promoting economic security and mobility.
If you are considering how to have impact in this area across several states or in your focal state, we invite you to reach out to Camber’s sector lead for Shared Prosperity, Marc Allen, at: marc@cambercollective.com.
End Notes
- ”Living in or near poverty” is defined here as living within 200% of the Federal Poverty Line (FPL). “Poverty population” is defined as living within 100% of the FPL.
- SPM is a more comprehensive assessment of Economic Security that takes into account additional measures such as (but not limited to): income level, safety net benefits, taxes & tax credits, and any stimulus checks.
- This article is generally focused on means-tested benefit programs serving those most economically insecure, as well as social insurance programs serving workers at risk of economic insecurity (e.g., unemployment insurance, workers’ compensation).
- Detail methodology and data sources for Methodology – Part 1: Which States Offer the Greatest Impact Potential?: We started with the states with highest anti-poverty effects & added their score (max 4) to scores of the potential scale of impact and equity gaps in addressing poverty (max 24). Ten states with the top scores were selected, and their scores were greater than 19. Anti-poverty effect score was assessed using Urban Institute microsimulation of SPM poverty reduction if 6 major, means-tested benefit programs had full participation and full funding. The cutoff for states considered was whether they fell into the top two quartiles for SPM poverty reduction, relative to the national average. For example, Hawaii’s poverty reduces by 158% of the national average. Each state in the top two quartiles was given a score of either 3 or 4, depending on their quartile. Then, to assess scale of impact and equity gaps, states were assigned a score between 1-4 depending on which quartile they were in for the following measures, with 4 being the highest quartile, and state’s max score for scale and equity gaps equaling 24. For example, California has the highest population in SPM poverty at 7.06M and was assigned a 4 for that measure.
Measures of scale were: 1) Population in poverty according to the Supplemental Poverty Measure (SPM), 2) Percent of population in SPM poverty, 3) Percent of population who are non-citizens, and 4) Percent of population who have a disability.
Measures for equity gaps were: 1) Difference in proportion of people of color in poverty SPM relative to general population, and 2) Difference in proportion of Hispanic population in poverty SPM relative to general population.
Data sources: Urban Institute, using the ATTIS model (Analysis of Transfers, Taxes, and Income Security) applied data from the 2018 American Community Survey that have been projected forward to represent 2022 population and economic circumstances; 2019-2021 American Community Survey, accessed via IPUMS - Detail on measures and data sources for Methodology – Part 2: Which State Typology Offers Opportunity for Impact Most Aligned with your Objectives?: To assign a typology for each state, we scored each state’s approach to benefit accessibility and the state’s efficiency of benefit delivery, relative to other states. The states were distributed evenly across horizontal and vertical axes based on their scores then assigned a typology for each quadrant. The indicators were summed into each state’s score.
Indicators for Benefit Access Policy Choices were as follows: 1) Whether the state adopted policy options that maximize access and reduce burden for claimants, indicated by implementation of SNAP broad-based categorical eligibility, SNAP Able Bodied Adults without Dependents time limit waiver, Unemployment Insurance income replacement rate relative to other states, TANF benefit amount relative to other states, and Medicaid expansion status. 2) Whether the state has funded state-specific tax credits, indicated by if the state has a state EITC, and if so, its rate relative to other states, and if the state has a state CTC. 3) Whether there is momentum in the state to pursue benefit access and delivery improvements, indicated by the number of formal benefit access improvement cohort has this state participated in, if there is legislative momentum in this state (i.e., recent state executive order related to benefit access or delivery, approval of 2023 summer Pandemic-EBT for children, recent Medicaid expansion).
Indicators for Efficiency of State Delivery System were as follows: 1) How user–friendly the benefit application process is, indicated by total time to apply, relative to other states, requirement for identity proofing, availability of online applications for TANF and WIC, and if there is a mobile-friendly online application. 2) How integrated the enrollment systems are, indicated by if Medicaid applications can be used for at least one other non-health program, if the Medicaid system determines eligibility for at least one non-health program, and if the state has joint processing and applications for SNAP and Medicaid. 3) How timely benefit delivery is, indicated by how often UI benefits are received within 21 days of application, relative to other states?
Data Sources: Code for America Safety Net Benefit Scorecard, 2019; Kaiser Family Foundation, 2018-2020, 2023 data; FNS – SNAP State Options Report, 2018 and Summer EBT 2023 update; The Century Foundation Unemployment Insurance Dashboard, 2022; TANF amounts, 2018; (6) Center on America Progress, Safety Net Strength Assessment, 2019; CBPP State CTC Analysis; Cohorts/Collaboratives: Safety Net Innovation Lab (Code for America), Integrated Benefits Initiative (Code for America, CBPP, Nava), Coordinating SNAP & Nutrition Supports (Share Our Strength, APHSA), Medicaid Learning Collaborative (BDT), Work Support Strategies, National Academy for State Health Policy’s (NASHP) Health and Housing Institute.
Sources
[i] Population living within 200% of Federal Poverty Line from U.S. Census Bureau, Current Population Survey, 2022 Annual Social and Economic Supplement (CPS ASEC)
[ii] CBPP analysis of US Census Bureau March 2019 CPS and published figures
[iii] CBPP analysis of SPM data from Columbia Center on Poverty and Social Policy (before 2009) and U.S. Census Bureau (2009 and on), accessed via IPUMS-CPS.
[iv] Rank, Mark Robert, Lawrence M. Eppard, and Heather E. Bullock, ‘Whites Are the Largest Racial Group Experiencing Poverty’, Poorly Understood: What America Gets Wrong About Poverty (New York, 2021; online edn, Oxford Academic, 20 May 2021), https://doi.org/10.1093/oso/9780190881382.003.0005.
[v] CBPP, 2020. Streamlining and Modernizing WIC Enrollment
[vi] National Council on Aging, 2022. Lifting Barriers to SNAP: Real Stories from Older Adults
[vii] Urban Institute, Five Ways Public Charge Rule Affects Immigrants in America
[viii] CBPP, 2021. TANF Policies Reflect Racist Legacy of Cash Assistance
[ix] Code for America, 2019. Bringing Social Safety Net Benefits Online.
[x] 2021 White House Executive Order on Transforming Federal Customer Experience and Service Delivery
[xi] The Century Foundation Unemployment Insurance Dashboard, accessed in June 2023.
[xii] Urban Institute, 2023. Customer Service Experiences and Enrollment Difficulties Vary Widely across Safety Net Programs.
[xiii] CBPP, 2021. TANF Policies Reflect Racist Legacy of Cash Assistance
[xiv] CBPP, 2022. Federal Rental Assistance Fact Sheets.
[xv] CBPP, 2015. Supplemental Security Income: An Important Anti-Poverty Program
[xvi] Urban Institute, 2017. Why Does Cash Welfare Depend on Where You Live
[xvii] The Urban Institute. CPS-ASEC survey data and TRIM3 simulations correcting for underreporting
[xviii] Benefits Data Trust Data Sharing Playbook.
[xix] U.S. Census Bureau, American Community Survey, 2022 accessed via IPUMS
[xx] Center on American Progress, 2021. How Weak Safety Net Policies Exacerbate Regional and Racial Inequality.
[xxi] The Urban Institute, 2023. A Safety Net with 100 Percent Participation: How Much Would Benefits Increase and Poverty Decline?
[xxii] The Urban Institute, 2023. A Safety Net with 100 Percent Participation: How Much Would Benefits Increase and Poverty Decline?
[xxiii] U.S. Census Bureau, American Community Survey, 2019 accessed via IPUMS
[xxiv] U.S. Census Bureau, American Community Survey, 2019 accessed via IPUMS
[xxv] U.S. Census Bureau, American Community Survey, 2019 accessed via IPUMS
[xxvi] Center on American Progress, 2021. How Weak Safety Net Policies Exacerbate Regional and Racial Inequality.
Manali Kulkarni utilizes a community-centered approach to generate qualitative and quantitative analytical insights that support clients in making strategic decisions to drive social impact. Her Master’s thesis at Stanford School of Medicine examined how negative birth experiences influence postpartum mental health outcomes for women in the US. During graduate school, she also designed, developed, and piloted an electronic health record app that works off-the-grid to streamline clinical data workflows in remote healthcare settings in Ghana as part of a Social Entrepreneurship Fellowship at Stanford d.school. She earned an MS in Community Health and Prevention Research from Stanford University, where she focused on design innovation for social impact. Prior to graduate school, she worked as a user experience researcher conducting formative, exploratory qualitative research to build a decision-making tool to support menopausal people.
Prior to joining Camber, Bethany Wiley developed and managed leadership programs for middle and high school girls at Girl Scouts of Greater Los Angeles. She began her career in land conservation and natural resource management, collaborating with private landowners to protect wilderness in Alaska and analyzing environmental impacts of development in Hawaii. She has further experience working in economic opportunity, reproductive rights, and social entrepreneurship. Bethany holds an MBA from the Kellogg School of Management at Northwestern University where she focused broadly on social impact and managing organizations. She also holds an MS in Earth Systems and a BA in Archaeology with Distinction from Stanford University. Bethany grew up just outside of Seattle and loves to get into the mountains whenever she can to hike, camp, backpack, and snowboard.
Director, Shared Prosperity Sector Lead Marc Allen draws on his experience as a strategist and policy attorney to advise organizations intent on redressing our economic and democratic systems, in the US and globally. In leading Camber’s Shared Prosperity portfolio, Marc has served national and state governments, global and local philanthropies, policy institutes, multilateral organizations, community service providers, and for-profit entities across a range of local, national, and international impact initiatives. His project work is oriented toward extending economic security, economic mobility/opportunity, and power/voice through improved investment, policy, programs, and representation. He also leads the Economic Narrative Coalition, a national effort to evolve the false narratives warping popular perceptions of poverty. Marc primarily supports these goals through versatile expertise in research/data analytics, strategic planning, and coalition-building with a preference for collaborative, data-driven, and nonpartisan approaches. Secondarily, he also guides executive teams in interrogating their own organization structures, missions, and business models.